- Cloud Security Lab a Week (S.L.A.W)
- Posts
- Build a Time-Based Threat Detector with Lambda and Athena
Build a Time-Based Threat Detector with Lambda and Athena
Time-based threat detectors allow us to identify activity beyond just a single API call. Today we'll build one with Lambda and Athena and learn about sliding windows.
Rich Mogull
August 07, 2025 • Estimated Reading Time: 7 minutes
If You’re Reading This, Drop Me A Line!
We are honing in on 70 labs in this crazy little project, and while I get to see all the stats I’m just curious at who has actually been keeping up with these lessons and labs now that we are in more advanced material. So drop me a quick email at [email protected], say hi, and let me know what else you want to see!
Prerequisites
Complete the Cross-Account Athena lab (which has a few prerequisites itself).
The Lesson
Over the past few labs we learned how to run security-style queries with Athena, which in the realm of SecOps (incident response) is one of our best tools for analyzing incidents. Keep in mind that everything we’ve covered would also translate to a commercial Security Information and Event Management (SIEM) product.
Today we’ll expand on the concept and learn how to use queries as threat detectors. A threat detector is basically an alarm. In SecOps we talk a lot about “indicators of compromise” and “indicators of attack” and other signs that an adversary is trying to break in (IoA) or has broken in (IoC). There’s a ton of art and science to these and we have various ways we can implement them.
There are many techniques and places to implement threat detection, including use of specialized tools like Intrusion Prevention System (IPS) network appliances. GuardDuty? Yep, that’s a threat detection service run by AWS that tracks various activities in your account looking for something suspicious based on what they are doing (e.g. making a bucket public) or who is doing it (like activity from a known-suspicious IP address). (If you are interested in detection engineering I highly recommend the Detection Engineering Weekly Newsletter by Zack Allen.).
We’ve already set up “detections” for public S3 buckets and GuardDuty alerts, but what about activity based on multiple things happening in our logs?
The following, for example, are potential threat activities that could show up in CloudTrail but we can’t capture with a single EventBridge rule or relying on something like GuardDuty:
Multiple failed/denied API calls over a time period that could indicate someone is trying to see what privileges an identity has.
A change in the user agent used for making API calls that indicates maybe a credential was compromised and is now used in an attack tool.
A sequence of actions that aren’t suspicious alone, but could indicate an attack when looked at together. Like the combination of GetCallerIdentity followed by Describe API calls followed by taking a snapshot of an instance and sharing it with a new account (as we showed in our incident analysis skills challenge).
All of these are in the logs, but to make them threat detectors we need to figure out how to trigger based on the activity.
Sliding Query Windows for Threat Detection
In my examples above, you probably noticed that some of the examples look like we could see them in a single query, while others might take a little more analysis. You can probably see how to run the queries yourself to look for the activity, but for threat detection we want something that runs automatically on a schedule.
This does have two problems:
You can run queries on a schedule, but what if one step of the attack happened before your query window?
You can’t always detect these patterns with a single query. For example, you can’t just write SQL for “find me every time the user agent for this role changes”.
Let me illustrate the first point. Imagine an attack with four steps, and it’s only a potential threat if we see all four of those things in a row. In an ideal world, we could run queries for any user that does all of those four things over, say, the past 15 minutes.

But what if those steps occur partially in one query’s time window, and partially in another?

Oops, we missed! But hey, you are all smart people (I mean, to a point, you are silly enough to be listening to me which shows terrible personal judgement). All we need to do is have overlapping/sliding query windows like this:

Notice how I extended the query window for EACH query by 5 minutes (to a 20 minute window) and run them every 5 minutes? With this overlap I shouldn’t miss the sequence that indicates the attack.
How do we figure out our time windows? There’s actually a formula that helps (ah crap, math 😭 ). Say we want to find 5 failed API calls within an hour, we just divide the detection window (60 minutes) by the number of actions (5) and thus run our query every 12 minutes.
This is better than how I illustrated it, since if you did the math you can see I should have kept my 15 minute query window and run it every 3.75 minutes. Either approach is valid depending on how important timing is. Usually, for threat detection, we don’t care if X actions occur in Y timeframe so we can play with our windows a bit to reduce the frequency of queries and save a little cash.
What I’ve illustrated here is the most basic way to approach the problem. It probably wouldn’t shock you to know that there are dedicated real-time stream-data analysis tools like Apache Flink for all sorts of advanced fun. Or we can send events we care about into a database like DynamoDB and run code or queries on top of that.
Anyway, the Flink logo is so cute I’m just going to paste it here and call it a day. We’ll cover some of the other scenarios in future labs.

Today’s lesson key points are:
Threat detectors look for activity that is known to be a potential indicator of attack or indicator of compromise (IoA means someone is possibly attacking, IoC means they maybe succeeded).
Scheduled queries are one common type of threat detector.
When using scheduled queries and look for time-series events that could indicate an attack, we use sliding windows so we don’t miss the threat.
Unless you are already using
The Lab
Today we will use a combination of EventBridge, Lambda, and Athena to run a query-based threat detector. Specifically we will look for 5 failed API calls over the past hour and use that 12 minute sliding time window. Why Lambda? Because there is no other way to schedule Athena queries.
WARNING: If you don’t follow the instructions at the end to shut this down after the lab you will end up with a big AWS bill!!!
Oh, and then we get all fancy and will transform our results into the Amazon Security Findings Format before we email them off (using our existing Security Hub alert SNS topic). Why ASFF? Because that’s what Security Hub uses natively in case we want to change things up later and push our findings into Security Hub directly.
Maybe I should have used OCSF, if you know what that is, but for our lab it doesn’t matter.
We’ll finish by running a CloudFormation template in our TestAccount1 that creates an IAM role and lambda function that can’t really do anything that then tries to do things and generates failed API calls.
Video Walkthrough
Step-by-Step
Start in your Sign-in portal > SecurityAudi > SecurityFullAdmin > us-west-2 region > CloudFormation.


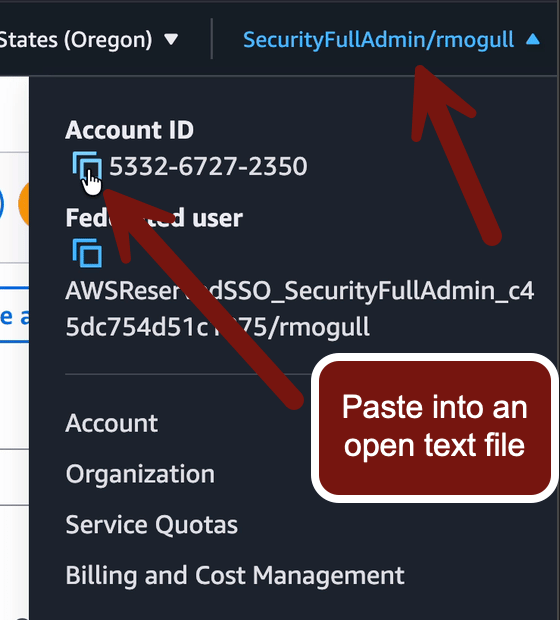
Quickly snag your Account ID from the upper right corner and paste it someplace safe since you will need it twice.
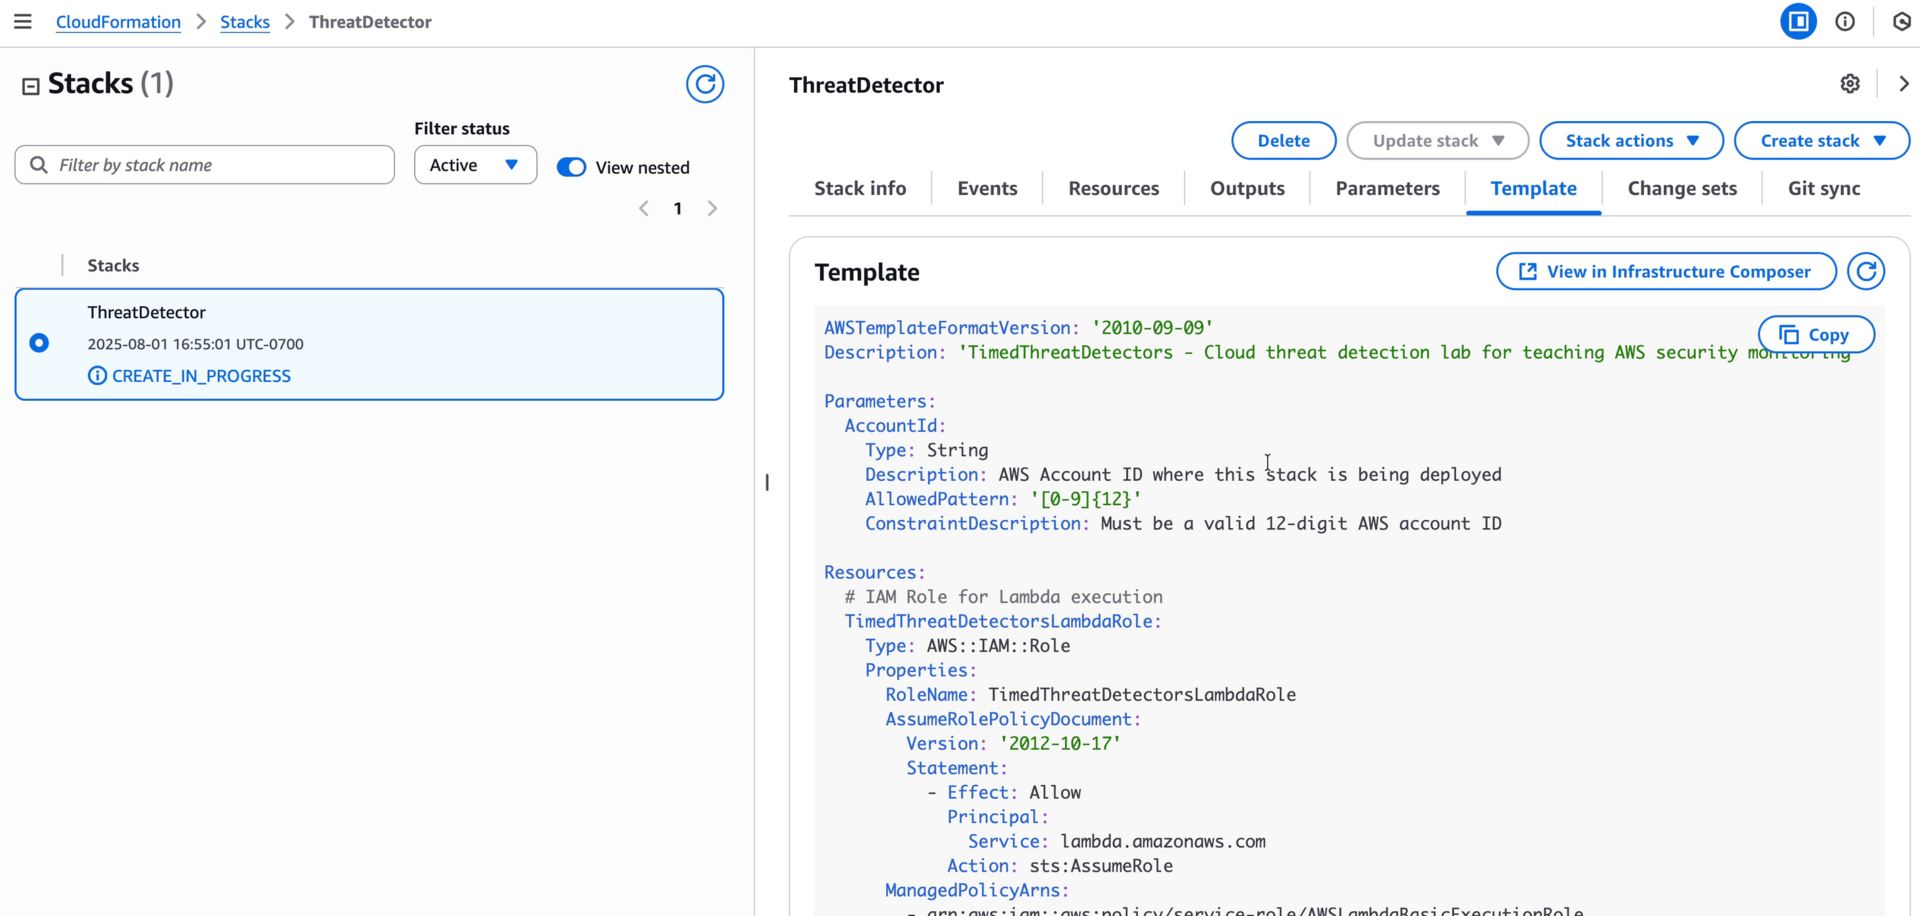
Then Create stack:

Deploy https://cloudslaw.s3-us-west-2.amazonaws.com/lab63.template
Name it Threat Detector
Paste in your Account ID
Click through the rest and Submit
I highly encourage you to read this one while it deploys. The tl;dr is it:
Creates a new role for our lambda function with permissions for Athena, S3, CloudWatch Logs, and SNS.
Creates a lambda function that:
Runs our query, which includes every user that has 5 failed API calls within the last hour (see below).
For every user with the 5 failed API calls, it creates an ASFF-formatted finding and sends it to our Security Hub SNS topic (that we made a while ago).
Creates an EventBridge rule to run our lambda function every 12 minutes.
The python code is pretty long so I encourage you to read that yourself, but here’s the core logic for our threat detector (our Athena query):
SELECT
     useridentity.arn as user_arn,
     COUNT(*) as failed_count,
     ARRAY_JOIN(ARRAY_AGG(DISTINCT eventname), '|||') as failed_actions,
     ARRAY_JOIN(ARRAY_AGG(DISTINCT useragent), '|||') as user_agents,
      MIN(eventtime) as first_failed_event_time,
      MAX(eventtime) as last_failed_event_time
FROM {DATABASE_NAME}.{TABLE_NAME}
WHERE
      from_iso8601_timestamp(eventtime) >= CURRENT_TIMESTAMP - INTERVAL '75' MINUTE
       AND errorcode IN ('AccessDenied', 'UnauthorizedAccess', 'UnauthorizedOperation')
       AND useridentity.arn IS NOT NULL
       AND useridentity.arn != ''
       GROUP BY useridentity.arn
       HAVING COUNT(*) > {FAILED_API_THRESHOLD}
It’s pulling the user identity, the event names (what the user tried to do), the user agent, (e.g. python or browser), the time of the first failed event and the time of the last failed event (useful for investigating).
Yes, I used an LLM to write that… and all the python code. And the CloudFormation. DON’T JUDGE ME!!!!
Okay with that deployed we need to make some modifications to the bucket policy in our LogAudit account since, right now, only our SecurityFullAdmin role has the cross-account privileges and this poor little lambda function is erroring out left and right until we give it access.
Close the tab > Sign in portal > LogArchive > AdministratorAccess > S3 > click your cloudtrail bucket > Permissions > scroll to Bucket Policy


The very top of your policy looks like this with a different account ID:

{
    "Version": "2012-10-17",
    "Statement": [
        {
            "Sid": "SecurityFullAdminCloudTrailAccess",
            "Effect": "Allow",
            "Principal": {
                "AWS": "arn:aws:iam::533267272350:role/aws-reserved/sso.amazonaws.com/us-west-2/AWSReservedSSO_SecurityFullAdmin_c45dc754d51c1875"
            },
You need to edit the policy to add in the IAM role used by the lambda function. This is a little tricky, so copy this and paste it into a text file so you can edit in your own details:
{
	"Version": "2012-10-17",
	"Statement": [
		{
			"Sid": "SecurityFullAdminCloudTrailAccess",
			"Effect": "Allow",
			"Principal": {
				"AWS": [
				"THE ARN OF YOUR SECURITYFULLADMIN ROLE IN THE OLD POLICY",
				"arn:aws:sts::YOUR ACCOUNT ID:assumed-role/TimedThreatDetectorsLambdaRole/TimedThreatDetectors"
				]
			},
Now paste the update in-place over the “old” version, making sure to check you didn’t mess up any commas or other characters.
The full policy will look like this when you are done.
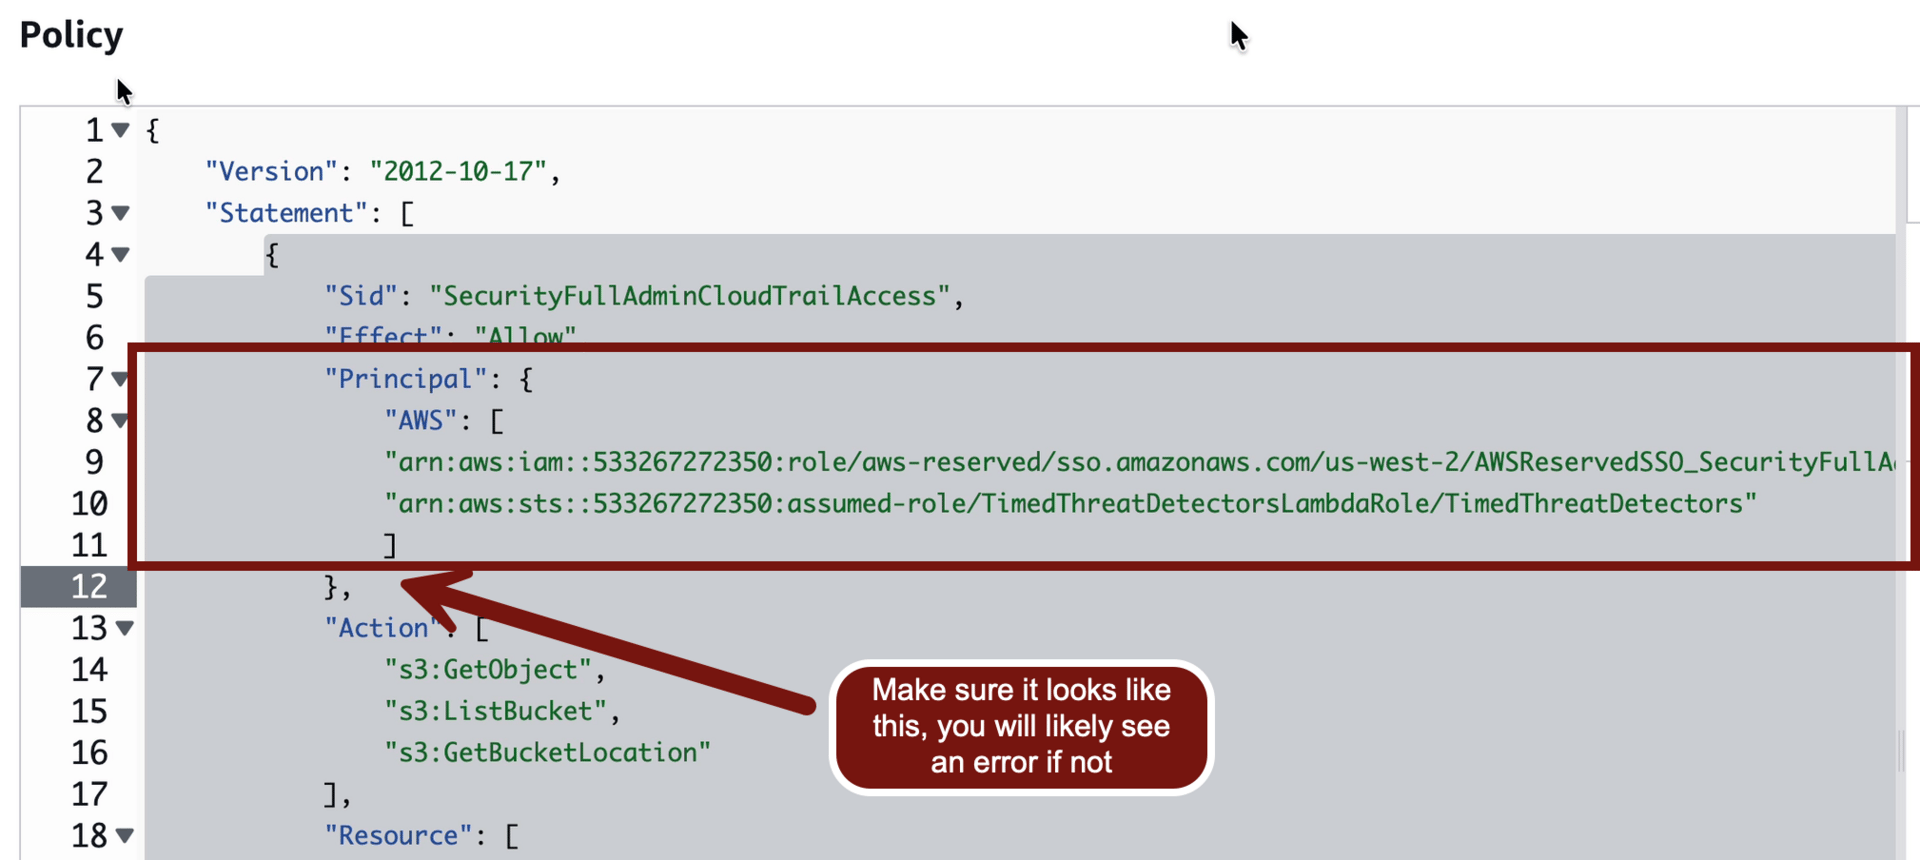
Scroll down and click Save changes!
Now it’s time to test! We will run a CloudFormation template that creates a lambda function with a role that doesn’t have any privileges, but still tries to do things, and an EventBridge rule to run it on a schedule. This will generate plenty of Denied API calls for our logs.
Close the tab > Sign in portal > TestAccount1 > CloudFormation > Create stack

Use https://cloudslaw.s3-us-west-2.amazonaws.com/lab63-test.template
Name it deleteme
Click through the rest and Submit

Walk away from your computer for 15 minutes, then Delete the stack!!!!

Now wait about 15-30 minutes (since it takes a little time for CloudTrail to write the logs to S3) and check your email. You should have an alert that looks like this:

Pretty cool, eh? We have a nicely-formatted alert based on an Athena query that’s running on a timed schedule with sliding windows!
🚨 WARNING: SHUT DOWN OR PAY THE PRICE! 🚨
After writing this lab, but before I released it, my billing alert went off. Running a lot of Athena queries on 3 months of logs is generating a lot of S3 overhead.
Your safest option is to delete the CloudFormation stack in SecurityAudit!
Alternatively, you can disable the EventBridge Rule, which stops the lambda from running and executing the queries. Deleting the stack is safest, and if we need this detector in the future for a lab I will provide a new stack to deploy it again.
-Rich
Reply